Tutorial: Spreadsheet Splitting - Step 3
The third step in our data cleaning tutorial is to split the filtered data set into two separate data sets. We will use the Wrangell Data tools to split the data set, and then save the two data sets as CSV files.
Here are all of the steps in the tutorial:
We will pick up where the Missing Data tutorial left off, with the filtered data set that contains no missing values.
Starting Data Set
We are going to use the filtered data set from the Missing Data section of the tutorial. The download for that file is here:
- Filtered SEO Data: The filtered data set that has no rows with missing values.
We’ll be using this data set as the starting point for the splitting tutorial.
Upload the Data to the CSV Splitter Tool
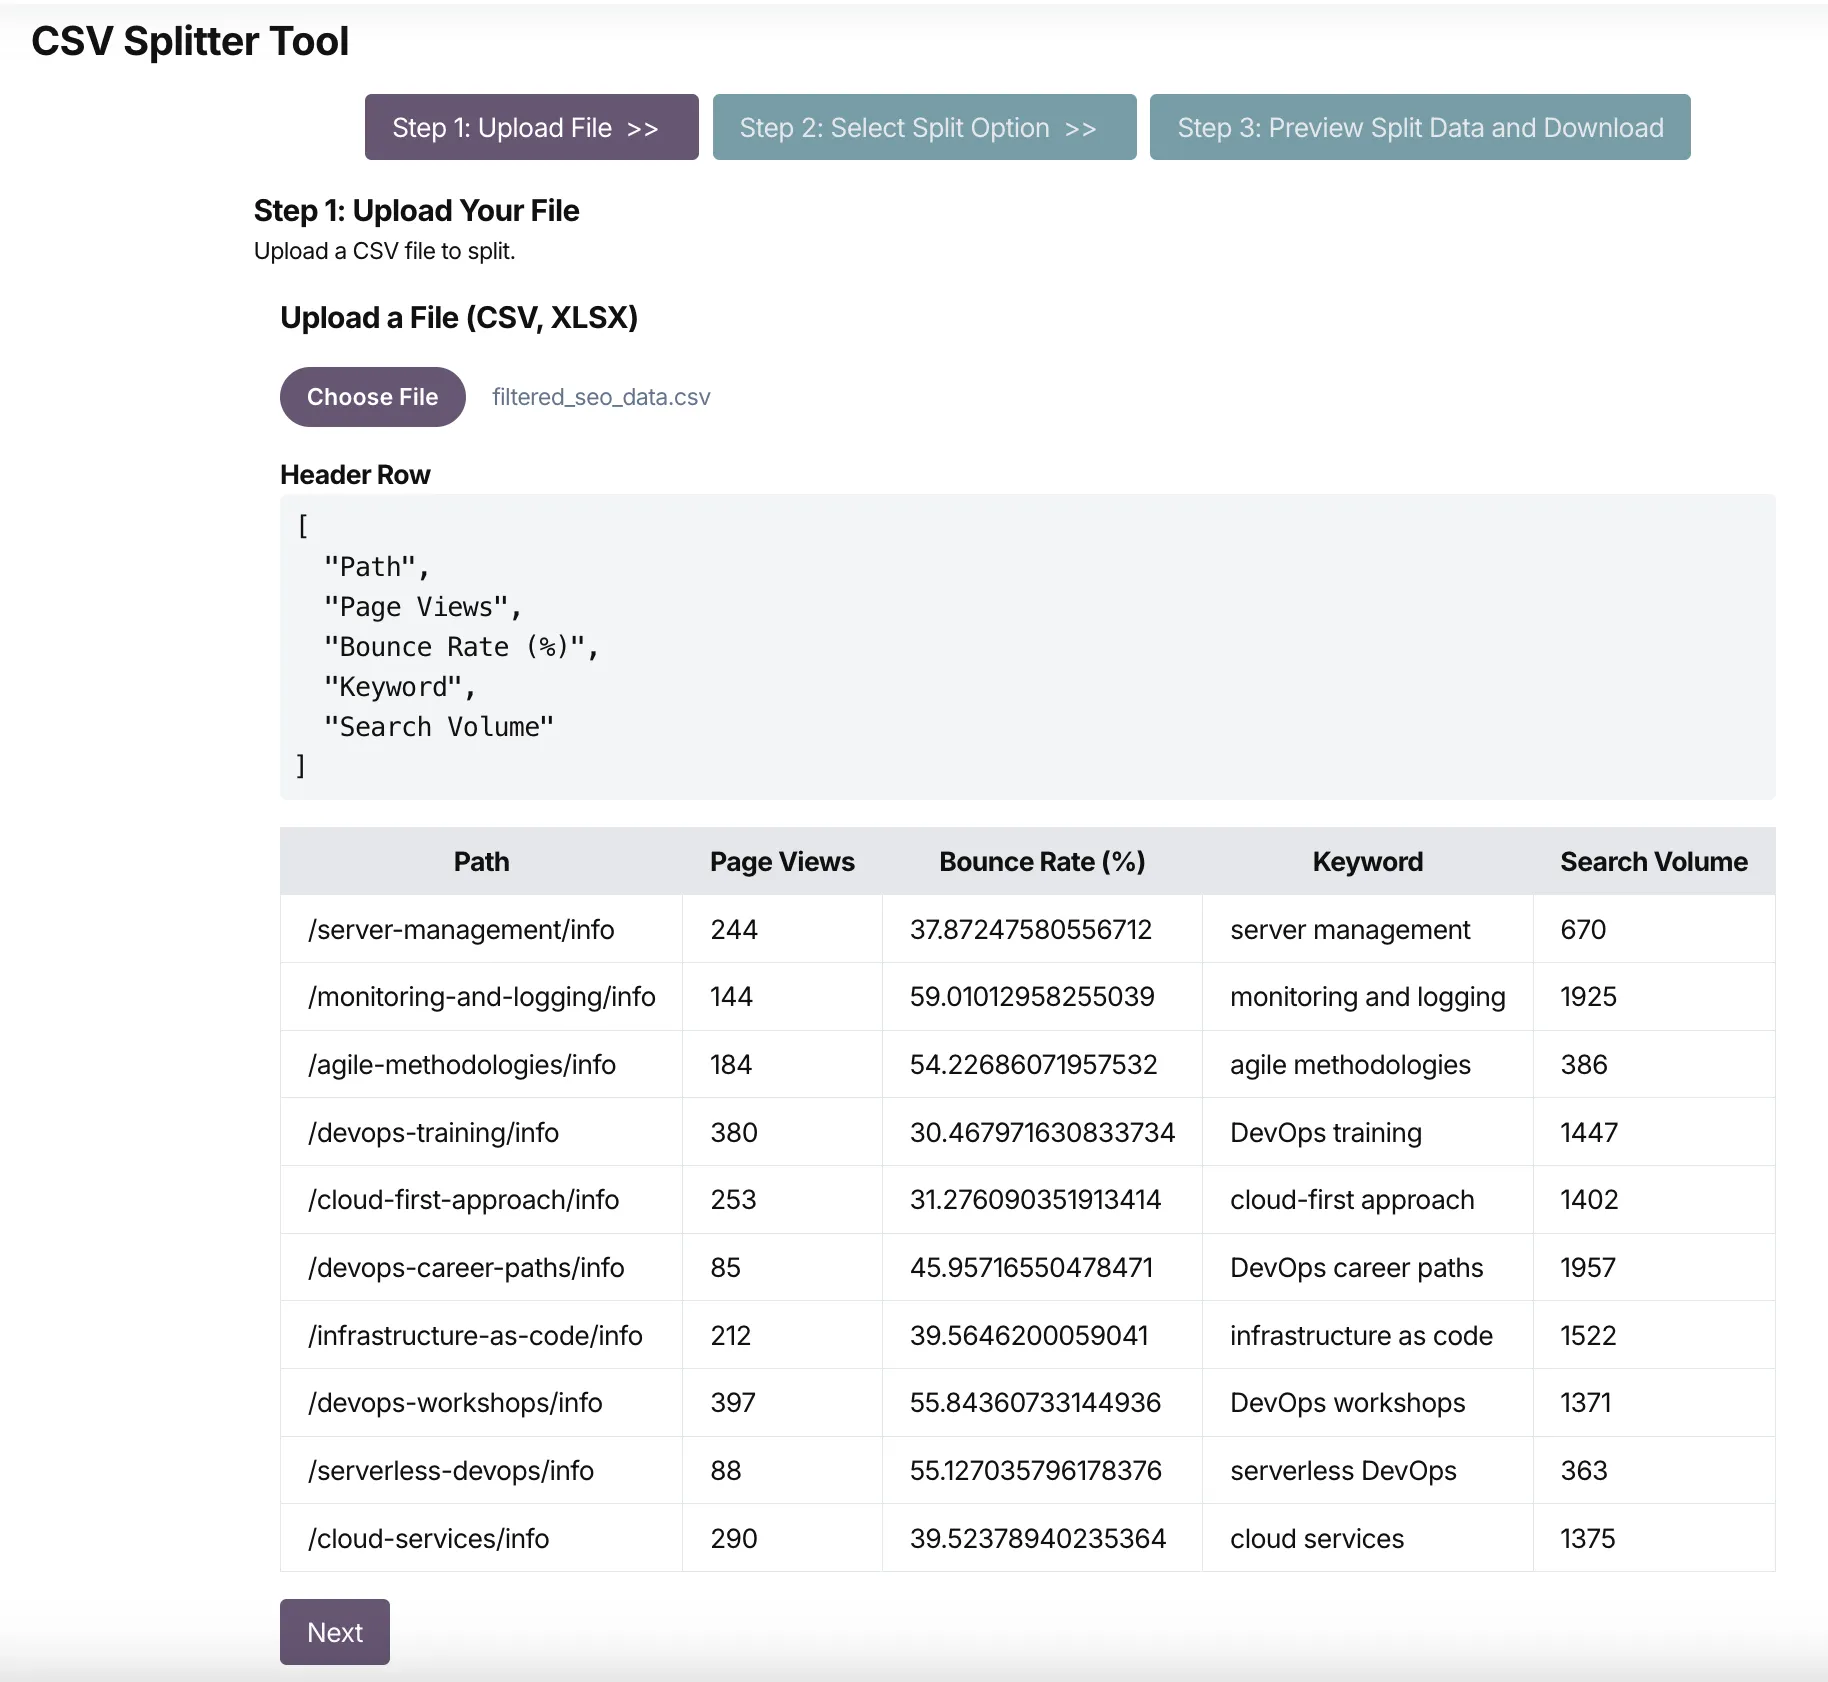
Visit the CSV Splitter tool and upload the filtered data set.

Once you preview the first few lines of the file, click the Next button to move on to the next step in the tool.
Splitting the Spreadsheet Data
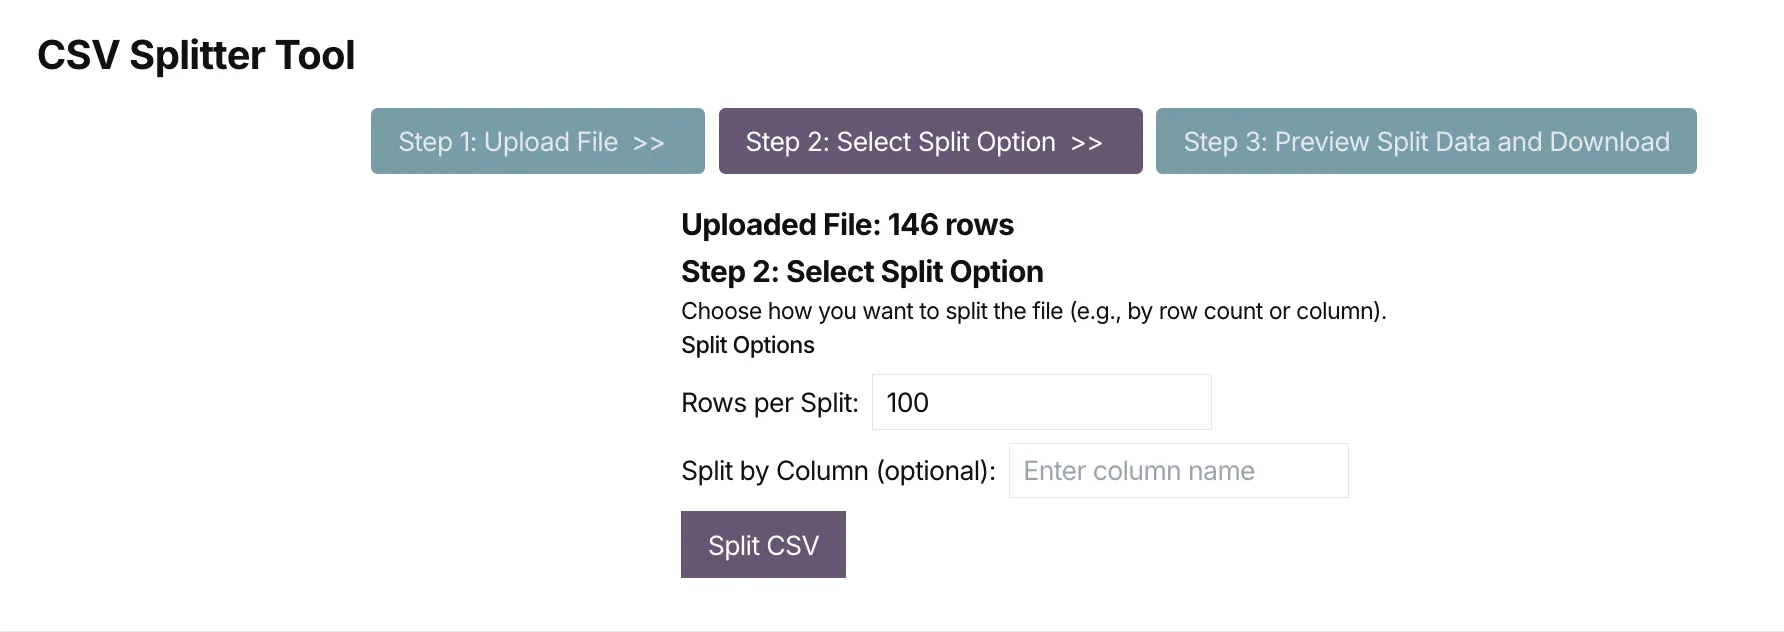
Once you upload the spreadsheet, you will get a summary of how many total rows were in the data set.
You get a choice of splitting the rows by number of rows or by the column name. In this case, we are going to split by the number of rows - the default of 100 is fine.

Click the Split CSV button to start the process.
Downloading the Split Data Sets
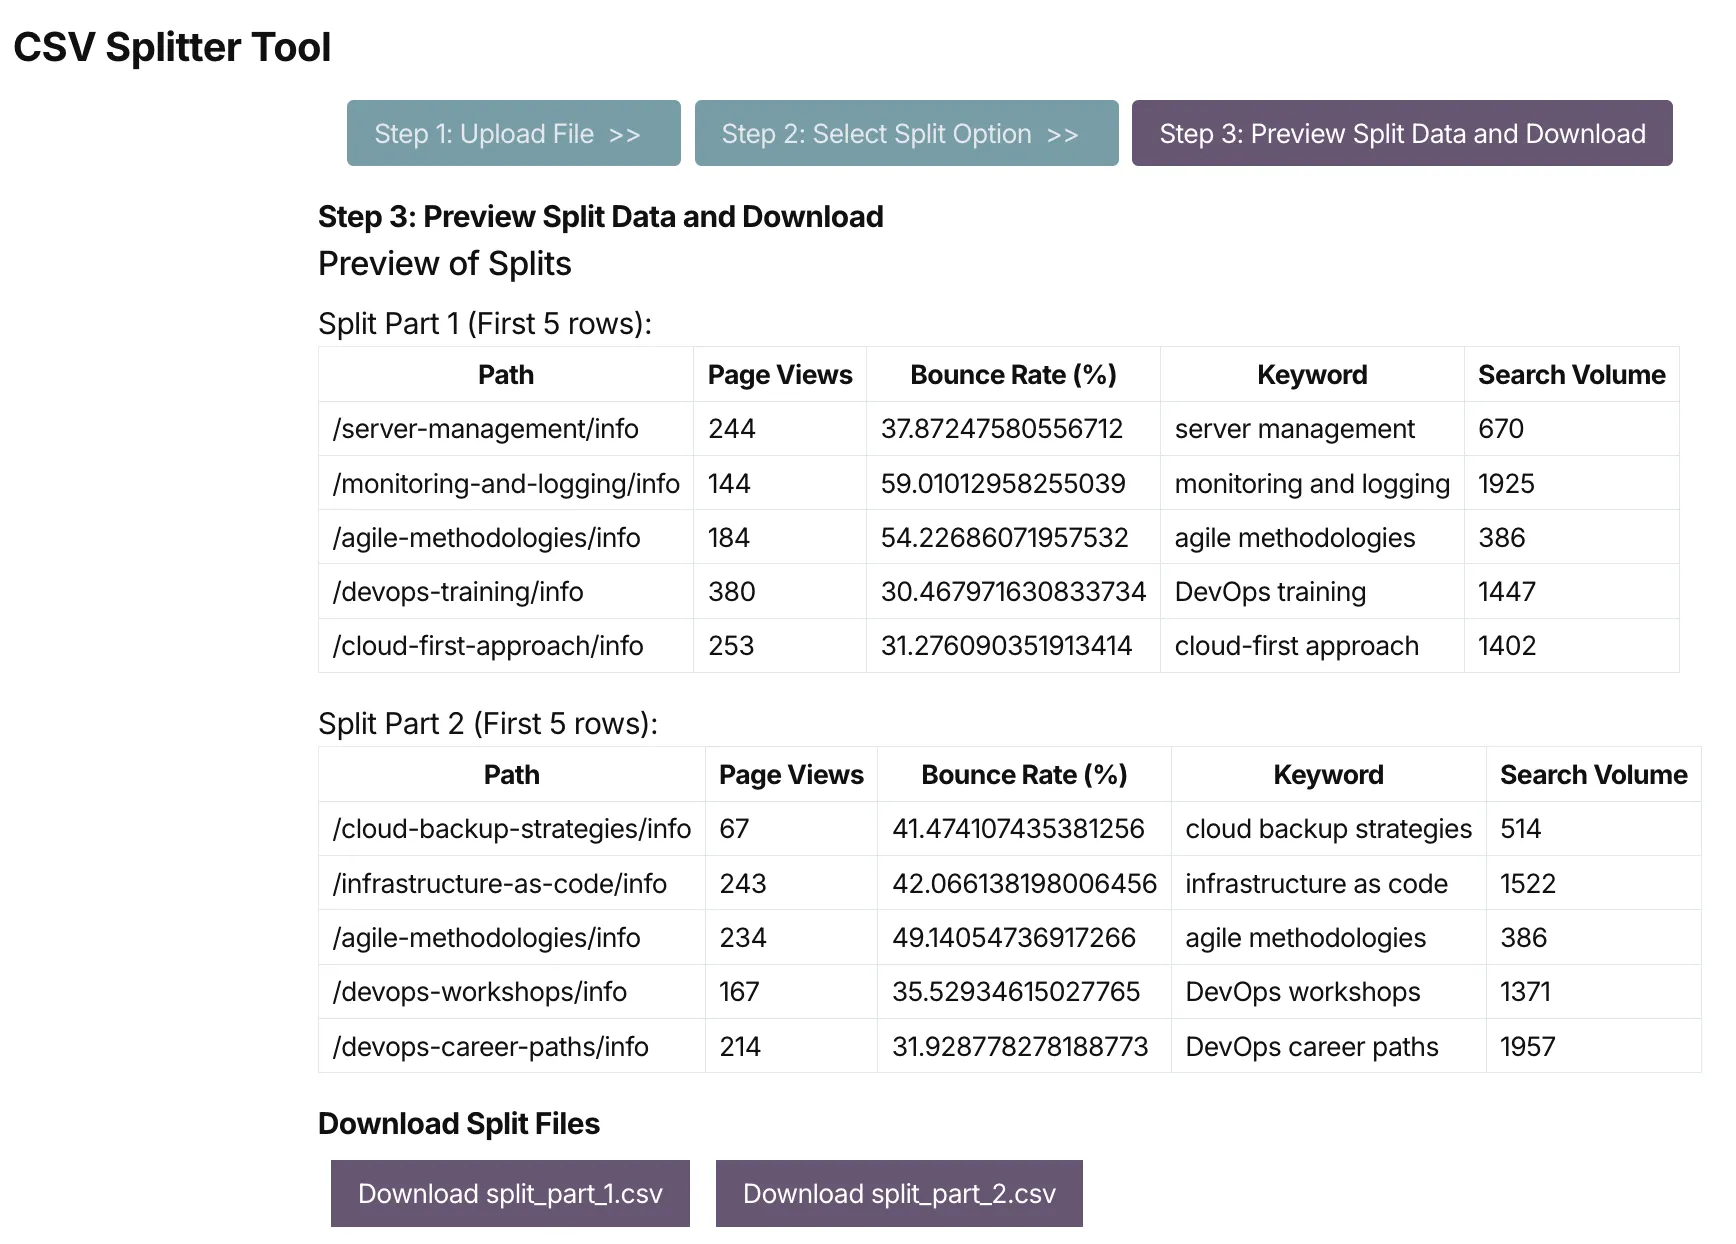
On the next step, you will see a preview of the two data sets that were created by the CSV Splitter tool.
If everything looks good, you can download the two data sets as CSV files.
Each CSV file has their own download button, so you can download them separately.

Once you download the two CSV files, you can open them in a spreadsheet application to see the entire data set.
One note - this CSV splitter tool does not randomize the rows in the split data sets. If you were looking to create training and test data splits for a machine learning project, you would need to randomize the rows in each data set before doing the split. This keeps the data sets from having any bias in the order of the rows.
